
From £750
Power BI or Tableau management / executive dashboard.
Project details →Data & Analytics
Turn fragmented data into decision-ready information.
For teams spending too much time preparing reports, reconciling data or relying on disconnected spreadsheets and manual processes.
Best fit
Capabilities
Pricing & engagement
Pricing note: Prices shown are starting points for a defined scope and are provided as a guide only. Final pricing will be confirmed after we review your requirements, environment, complexity and any implementation or third-party needs.
From £750
Power BI or Tableau management / executive dashboard.
Project details →From £1,000
Move manual Excel-heavy reporting to governed, automated BI.
Project details →From £1,000
Source, mapping, transformation and data-quality assessment.
Project details →From £1,500
Data and BI roadmap, governance and target architecture.
Project details →From £495/month
Dashboard support, KPI maintenance and reporting review.
Support packages →From £995/month
Ongoing BI, reporting and data-engineering support.
Support packages →From £1,750/month
Senior data strategy, governance and delivery oversight.
Support packages →Full Data Lifecycle
We support the full data lifecycle — from source systems, data modelling and ETL through to executive dashboards, KPI frameworks, cloud analytics and self-service reporting.
Executive dashboards, KPI reporting and stakeholder-focused decision support.
ETL/ELT pipelines, cloud processing, orchestration, transformation and data quality.
Data marts, dimensional modelling, mapping, migration and performance optimisation.
Replace spreadsheet-heavy reporting with automated, governed and self-service analytics.
Sector Experience
Our data expertise has been shaped by organisations where reporting accuracy, operational insight, customer behaviour, financial performance and service delivery matter every day.
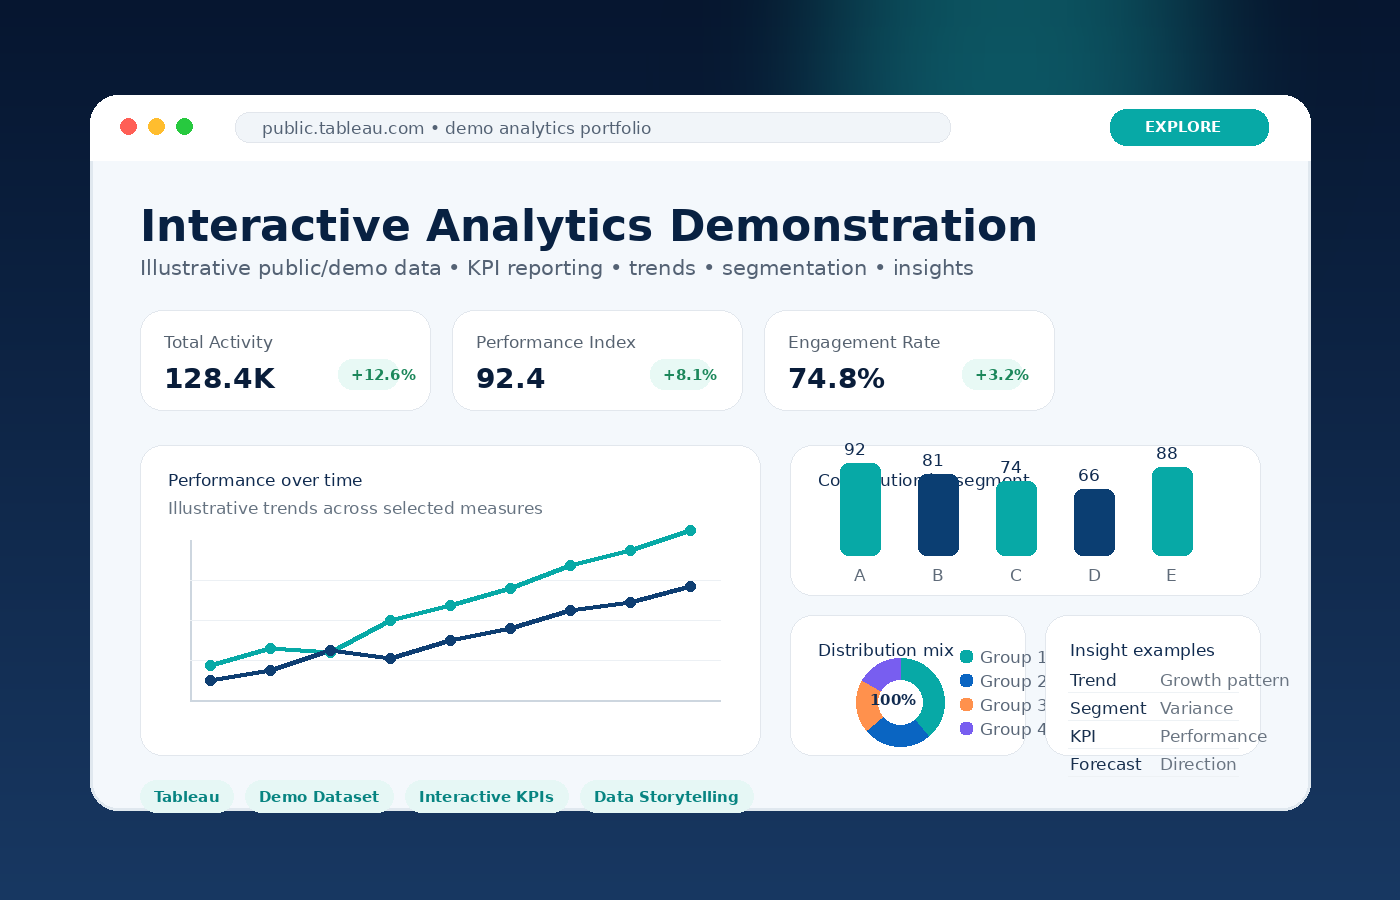
Tableau Analytics Demonstration
These Tableau Public examples use public or demonstration datasets to illustrate the type of analysis, visualisation, KPI reporting and data storytelling EaseThat can provide. They are not linked to any specific client, company or industry.
Demonstration only: Tableau Public examples use public or sample datasets solely to demonstrate analytical and visualisation capability. They do not contain client data and are not intended to represent work for any particular industry.
Business outcomes
Less manual report preparation
More consistent KPI definitions
Better access to trusted management information
A scalable data foundation for automation and AI
How to engage
Start with one high-value reporting problem, a data-quality review, a dashboard project or a broader data and BI roadmap.
Explore before you decide
Explore when spreadsheet-led reporting should move to a governed analytics platform.
Messages are processed by OpenAI to provide AI service guidance. Please do not share sensitive information. EaseThat does not store chat transcripts in this theme. Answers may be imperfect; EaseThat confirms scope, pricing and contractual details. Privacy information.